
 Search
 Feedback
 About
About Help
Help News
News
| Listing 1 - 7 of 7 |
Sort by
|
ISBN: 9780387681207 0387345426 9780387345420 0387964266 0387681205 9780387964263 Year: 2007 Publisher: New York, NY : Springer New York : Imprint: Springer,
Abstract | Keywords | Export | Availability | Bookmark
 Loading...
Choose an application
- Reference Manager
- EndNote
- RefWorks (Direct export to RefWorks)
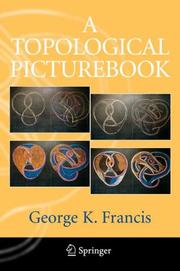
Praise for George Francis's A Topological Picturebook: Bravo to Springer for reissuing this unique and beautiful book! It not only reminds the older generation of the pleasures of doing mathematics by hand, but also shows the new generation what ``hands on'' really means. - John Stillwell, University of San Francisco The Topological Picturebook has taught a whole generation of mathematicians to draw, to see, and to think. - Tony Robbin, artist and author of Shadows of Reality: The Fourth Dimension in Relativity, Cubism, and Modern Thought The classic reference for how to present topological information visually, full of amazing hand-drawn pictures of complicated surfaces. - John Sullivan, Technische Universitat Berlin A Topological Picturebook lets students see topology as the original discoverers conceived it: concrete and visual, free of the formalism that burdens conventional textbooks. - Jeffrey Weeks, author of The Shape of Space A Topological Picturebook is a visual feast for anyone concerned with mathematical images. Francis provides exquisite examples to build one's "visualization muscles". At the same time, he explains the underlying principles and design techniques for readers to create their own lucid drawings. - George W. Hart, Stony Brook University In this collection of narrative gems and intriguing hand-drawn pictures, George Francis demonstrates the chicken-and-egg relationship, in mathematics, of image and text. Since the book was first published, the case for pictures in mathematics has been won, and now it is time to reflect on their meaning. A Topological Picturebook remains indispensable. - Marjorie Senechal, Smith College and co-editor of the Mathematical Intelligencer.
Mathematics. --- Topology. --- Geometry. --- Mathématiques --- Géométrie --- Topologie --- Topology --- Mathematics --- Physical Sciences & Mathematics --- Geometry --- Graphic methods --- Analysis situs --- Position analysis --- Rubber-sheet geometry --- Graphic methods. --- Topologie. Méthodes graphiques. --- Topologie. Grafische methoden. --- Polyhedra --- Set theory --- Algebras, Linear --- Euclid's Elements --- Géometrie --- Infographie --- Topology - Graphic methods.
Book
ISBN: 9781461407973 9781461407966 Year: 2011 Publisher: New York : Springer,
Abstract | Keywords | Export | Availability | Bookmark
Loading...Choose an application
- Reference Manager
- EndNote
- RefWorks (Direct export to RefWorks)
This introductory text in graph theory focuses on partial cubes, which are graphs that are isometrically embeddable into hypercubes of an arbitrary dimension, as well as bipartite graphs, and cubical graphs. This branch of graph theory has developed rapidly during the past three decades, producing exciting results and establishing links to other branches of mathematics. Currently, Graphs and Cubes is the only book available on the market that presents a comprehensive coverage of cubical graph and partial cube theories. Many exercises, along with historical notes, are included at the end of every chapter, and readers are encouraged to explore the exercises fully, and use them as a basis for research projects. The prerequisites for this text include familiarity with basic mathematical concepts and methods on the level of undergraduate courses in discrete mathematics, linear algebra, group theory, and topology of Euclidean spaces. While the book is intended for lower-division graduate students in mathematics, it will be of interest to a much wider audience; because of their rich structural properties, partial cubes appear in theoretical computer science, coding theory, genetics, and even the political and social sciences.
Statistical science --- Discrete mathematics --- Mathematical statistics --- Mathematics --- grafieken --- statistiek --- wiskunde --- Graph theory --- Geometry --- Théorie des graphes --- Graphic methods --- EPUB-LIV-FT LIVMATHE LIVSTATI SPRINGER-B
Book
ISBN: 9780321811981 0321811984 Year: 2012 Publisher: Berkeley New Riders
Abstract | Keywords | Export | Availability | Bookmark
Loading...Choose an application
- Reference Manager
- EndNote
- RefWorks (Direct export to RefWorks)
Provides lessons to help users design and deliver creative presentations using Microsoft PowerPoint.
Advertising. Public relations --- Computer architecture. Operating systems --- digitale ontwerptechnieken --- presentatietechnieken --- reclame --- reclamevormgeving --- presenteren --- Industrial psychology --- Business presentations. --- Multimedia systems in business presentations. --- Business presentations --- Graphic methods --- Computer programs. --- Microsoft PowerPoint (Computer file) --- Presentaties --- Communicatie --- Presentatietechnieken --- Spreekkunst --- Presentations, Business --- Business communication --- PowerPoint --- Microsoft Power point --- Microsoft PowerPoint for Windows --- PowerPoint for Windows --- Microsoft PowerPoint for Windows 95 --- PowerPoint for Windows 95 --- Microsoft PowerPoint 97 --- Microsoft PowerPoint version 2002 --- PowerPoint XP --- Microsoft Office PowerPoint 2007 --- Presentatietechnieken. --- storytelling --- Multimedia systems in business presentations --- Graphic methods&delete& --- Computer programs
Book
ISBN: 9780387981406 9780387981413 0387981403 038798142X 9786612509919 1282509918 0387981411 Year: 2009 Publisher: New York : Springer,
Abstract | Keywords | Export | Availability | Bookmark
Loading...Choose an application
- Reference Manager
- EndNote
- RefWorks (Direct export to RefWorks)
This book describes ggplot2, a new data visualization package for R that uses the insights from Leland Wilkison's Grammar of Graphics to create a powerful and flexible system for creating data graphics. With ggplot2, it's easy to: produce handsome, publication-quality plots, with automatic legends created from the plot specification superpose multiple layers (points, lines, maps, tiles, box plots to name a few) from different data sources, with automatically adjusted common scales add customisable smoothers that use the powerful modelling capabilities of R, such as loess, linear models, generalised additive models and robust regression save any ggplot2 plot (or part thereof) for later modification or reuse create custom themes that capture in-house or journal style requirements, and that can easily be applied to multiple plots approach your graph from a visual perspective, thinking about how each component of the data is represented on the final plot This book will be useful to everyone who has struggled with displaying their data in an informative and attractive way. You will need some basic knowledge of R (i.e. you should be able to get your data into R), but ggplot2 is a mini-language specifically tailored for producing graphics, and you'll learn everything you need in the book. After reading this book you'll be able to produce graphics customized precisely for your problems, and you'll find it easy to get graphics out of your head and on to the screen or page. Hadley Wickham is an Assistant Professor of Statistics at Rice University, and is interested in developing computational and cognitive tools for making data preparation, visualization, and analysis easier. He has developed 15 R packages and in 2006 he won the John Chambers Award for Statistical Computing for his work on the ggplot and reshape R packages.
Mathematical statistics --- Graphic methods --- R (Computer program language) --- Méthodes graphiques --- R (Langage de programmation) --- Graphic methods. --- Datenanalyse. --- Graphische Darstellung. --- Plot (Graphische Darstellung) --- R (Programm) --- Visualisierung. --- 001.4226 --- GNU-S (Computer program language) --- Domain-specific programming languages --- Graphics --- Graphs --- Geometrical drawing --- Least squares --- Mathematics --- Mechanical drawing --- Methoden en technieken --- statistiek --- R (Computer program language). --- Mathematical Statistics --- Elementary Mathematics & Arithmetic --- Physical Sciences & Mathematics --- Plot (Graphische Darstellung). --- R (Programm). --- statistiek. --- Méthodes graphiques --- EPUB-LIV-FT LIVMATHE LIVSTATI SPRINGER-B --- Mathematical statistics. --- Visualization. --- Computer graphics. --- Statistics and Computing/Statistics Programs. --- Computer Graphics. --- Datenanalyse --- Graphische Darstellung --- Visualisierung --- Visualisation --- Imagination --- Visual perception --- Imagery (Psychology) --- Statistical inference --- Statistics, Mathematical --- Statistics --- Probabilities --- Sampling (Statistics) --- Automatic drafting --- Graphic data processing --- Graphics, Computer --- Computer art --- Graphic arts --- Electronic data processing --- Engineering graphics --- Image processing --- Statistical methods --- Digital techniques --- Statistics . --- Mathematics. --- Math --- Science --- Statistical analysis --- Statistical data --- Statistical science --- Econometrics
ISBN: 9780387713922 0387713921 9780387713939 144192440X 9786610943951 1280943955 038771393X Year: 2007 Publisher: New York, NY : Springer New York : Imprint: Springer,
Abstract | Keywords | Export | Availability | Bookmark
Loading...Choose an application
- Reference Manager
- EndNote
- RefWorks (Direct export to RefWorks)
This book presents some recent developments in correlated data analysis. It utilizes the class of dispersion models as marginal components in the formulation of joint models for correlated data. This enables the book to handle a broader range of data types than those analyzed by traditional generalized linear models. One example is correlated angular data. This book provides a systematic treatment for the topic of estimating functions. Under this framework, both generalized estimating equations (GEE) and quadratic inference functions (QIF) are studied as special cases. In addition to marginal models and mixed-effects models, this book covers topics on joint regression analysis based on Gaussian copulas and generalized state space models for longitudinal data from long time series. Various real-world data examples, numerical illustrations and software usage tips are presented throughout the book. This book has evolved from lecture notes on longitudinal data analysis, and may be considered suitable as a textbook for a graduate course on correlated data analysis. This book is inclined more towards technical details regarding the underlying theory and methodology used in software-based applications. Therefore, the book will serve as a useful reference for those who want theoretical explanations to puzzles arising from data analyses or deeper understanding of underlying theory related to analyses. Peter Song is Professor of Statistics in the Department of Statistics and Actuarial Science at the University of Waterloo. Professor Song has published various papers on the theory and modeling of correlated data analysis. He has held a visiting position at the University of Michigan School of Public Health (Ann Arbor, Michigan).
Correlation (Statistics) --- Generalized estimating equations. --- Longitudinal method. --- Corrélation (Statistique) --- Méthode longitudinale --- Correlation (Statistics). --- Generalized estimating equations --- Longitudinal method --- Mathematical Statistics --- Mathematics --- Physical Sciences & Mathematics --- 519.535 --- Longitudinal research --- Longitudinal studies --- Methodology --- Research --- Social sciences --- Estimating equations, Generalized --- Equations, Generalized estimating --- GEE (Statistics) --- Linear models (Statistics) --- Least squares --- Mathematical statistics --- Probabilities --- Regression analysis --- Statistics --- Instrumental variables (Statistics) --- Graphic methods --- Mathematics. --- Probabilities. --- Statistics. --- Probability Theory and Stochastic Processes. --- Statistical Theory and Methods. --- Distribution (Probability theory. --- Mathematical statistics. --- Statistical inference --- Statistics, Mathematical --- Sampling (Statistics) --- Distribution functions --- Frequency distribution --- Characteristic functions --- Statistical methods --- Statistics . --- Probability --- Combinations --- Chance --- Risk --- Statistical analysis --- Statistical data --- Statistical science --- Econometrics
Book
ISBN: 9781441900517 9781441900524 Year: 2009 Publisher: New York Springer
Abstract | Keywords | Export | Availability | Bookmark
Loading...Choose an application
- Reference Manager
- EndNote
- RefWorks (Direct export to RefWorks)
R, a free and open source program, is one of the most powerful and the fastest-growing statistics program. Microsoft Excel is the most widely used spreadsheet program, but many statisticians consider its statistical tools too limited. In this book, the authors build on RExcel, a free add-in for Excel that can be downloaded from the R distribution network. RExcel seamlessly integrates the entire set of R's statistical and graphical methods into Excel, allowing students to focus on statistical methods and concepts and minimizing the distraction of learning a new programming language. Data can be transferred between R and Excel "the Excel way" by selecting worksheet ranges and using Excel menus. R's basic statistical functions and selected advanced methods are available from an Excel menu. Results of the computations and statistical graphics can be returned back into Excel worksheet ranges. RExcel allows the use of Excel scroll bars and check boxes to create and animate R graphics as an interactive analysis tool. The book is designed as a computational supplement to introductory statistics texts and the authors provide RExcel examples covering the topics of the introductory course. Richard M. Heiberger is Professor of Statistics at Temple University. He participated in the design of the S-Plus and R linear model and analysis of variance functions while on research leave at Bell Labs. He is the author of and contributor to various R packages. He is an Elected Fellow of the American Statistical Association (ASA) and the Chair Elect of the ASA Section on Statistical Computing. Erich Neuwirth is Professor of Computer Science at the University of Vienna and was formerly Professor of Statistics. He is the author of RExcel, and author of and contributor to various R packages. He is coauthor of Mathematical Modeling with Excel, winner of the European Academic Software Award 1996 (for a project combining mathematics and music), and Associate Editor for Computational Statistics and Journal of Statistical Software.
Programming --- Mathematical statistics --- Statistics. --- Statistics and Computing/Statistics Programs. --- Mathematical statistics. --- Statistique --- Statistique mathématique --- 519.2 --- R (Computer program language) --- Microsoft Excel (Computer file) --- -Graphical modeling (Statistics) --- 519.55 --- Multivariate analysis --- Mathematics --- Statistical inference --- Statistics, Mathematical --- Statistics --- Probabilities --- Sampling (Statistics) --- GNU-S (Computer program language) --- Domain-specific programming languages --- Probability. Mathematical statistics --- Data processing --- Graphic methods --- Statistical methods --- 519.2 Probability. Mathematical statistics --- Graphical modeling (Statistics) --- Microsoft Excel for the Macintosh --- Microsoft Excel for Windows --- Excel (Computer file) --- Excel for Windows --- Microsoft Excel for Windows 95 --- Excel 97 --- Microsoft Excel 97 for Windows --- Excel 2000 --- Excel 2000 for Windows 95 --- Microsoft Excel 2002 --- Microsoft Office Excel 2003 --- Excel 2003 --- Microsoft Excel 2007 --- Excel 2007 --- Excel 2010 --- Microsoft Excel 2013 --- Excel 2013 --- Microsoft Excel 2016 --- Excel 2016
Book
ISBN: 9781846289927 1846289904 9781846289903 9786612823404 1846289920 128282340X Year: 2007 Publisher: London : Springer London : Imprint: Springer,
Abstract | Keywords | Export | Availability | Bookmark
Loading...Choose an application
- Reference Manager
- EndNote
- RefWorks (Direct export to RefWorks)
The 15th International Conference on Conceptual Structures (ICCS 2007) is the latest in a series of annual conferences that have been held in Europe, Australia, and North America since 1993. Some of the world's best minds in information technology, arts, humanities and social science converged to explore novel ways that information and communications technology (ICT) can augment human intelligence, the longstanding objective of research and development efforts dating back to the pioneers Vannevar Bush and Douglas Engelbart. Topics covered include Formal Concept Analysis, Description Logics, the Semantic Web, the Pragmatic Web, Ontologies, Multi-agent Systems, Concept Mapping, and more. The conceptual structures represent a family of approaches that build on the successes of artificial intelligence, business intelligence, computational linguistics, conceptual modelling, information and web technologies, user modelling, and knowledge management. The workshop proceedings from ICCS 2007 provided a holistic forum for the dissemination of research results within the context of conceptual structures, including key research findings in Ontology Engineering, Grid Services, Knowledge Management, and Knowledge driven Bio-Informatics.
Computer Science. --- User Interfaces and Human Computer Interaction. --- Computational Biology/Bioinformatics. --- Artificial Intelligence (incl. Robotics). --- Data Mining and Knowledge Discovery. --- Computer science. --- Data mining. --- Artificial intelligence. --- Bioinformatics. --- Informatique --- Exploration de données (Informatique) --- Intelligence artificielle --- Bio-informatique --- Computational complexity -- Congresses. --- Computational complexity. --- Computer science -- Congresses. --- Conceptual structures (Information theory) --- Graph theory --- Logic diagrams --- Knowledge representation (Information theory) --- Natural language processing (Computer science) --- Computer Science --- Engineering & Applied Sciences --- Diagrams, Logic --- Logic --- Diagrams --- Graphic methods --- Coding theory. --- User interfaces (Computer systems). --- Coding and Information Theory. --- Artificial Intelligence. --- AI (Artificial intelligence) --- Artificial thinking --- Electronic brains --- Intellectronics --- Intelligence, Artificial --- Intelligent machines --- Machine intelligence --- Thinking, Artificial --- Bionics --- Cognitive science --- Digital computer simulation --- Electronic data processing --- Logic machines --- Machine theory --- Self-organizing systems --- Simulation methods --- Fifth generation computers --- Neural computers --- Bio-informatics --- Biological informatics --- Biology --- Information science --- Computational biology --- Systems biology --- Informatics --- Science --- Data compression (Telecommunication) --- Digital electronics --- Information theory --- Signal theory (Telecommunication) --- Computer programming --- Algorithmic knowledge discovery --- Factual data analysis --- KDD (Information retrieval) --- Knowledge discovery in data --- Knowledge discovery in databases --- Mining, Data --- Database searching --- Data processing --- Information theory. --- Interfaces, User (Computer systems) --- Human-machine systems --- Human-computer interaction --- Communication theory --- Communication --- Cybernetics
| Listing 1 - 7 of 7 |
Sort by
|